Oconee State Bank Annual Report
An interactive digital annual report for Oconee State Bank, featuring animated hero elements, interactive financial charts and detailed sections that showcase the bank’s performance, leadership and community initiatives.
- Role
- Frontend Developer
- Timeline
- 2022
- Client
- Oconee State Bank
Technologies
Overview
This project delivers a modern, web‑based annual report for Oconee State Bank. Users can explore sections such as the corporate profile, president’s letter, financial and asset quality highlights, board of directors bios, core values and community outreach. Each section incorporates animations and data visualisations to engage visitors and effectively communicate the bank’s story.
Responsibilities
- Built a responsive Next.js application styled with Tailwind CSS
- Implemented animated hero area with an interactive map using Framer Motion and custom tooltip components
- Developed Chart.js visualisations for net income, book value per share, total assets, loans and deposits (2017–2021)
- Structured modular React components for sections like the corporate profile, president’s letter, financial highlights and asset quality highlights
- Added scroll‑triggered animations with react‑intersection‑observer and ensured accessibility across devices
Challenges
Managing a large amount of narrative content and data across multiple sections while maintaining performance and consistency. It required careful optimisation of animations and chart rendering and thoughtful responsive design to ensure the report was accessible on both desktop and mobile devices.
Outcomes
Delivered a polished annual report site that communicates Oconee State Bank’s achievements and values. Interactive charts and engaging animations help visitors grasp key financial metrics and understand the bank’s culture and community impact.
Project Overview
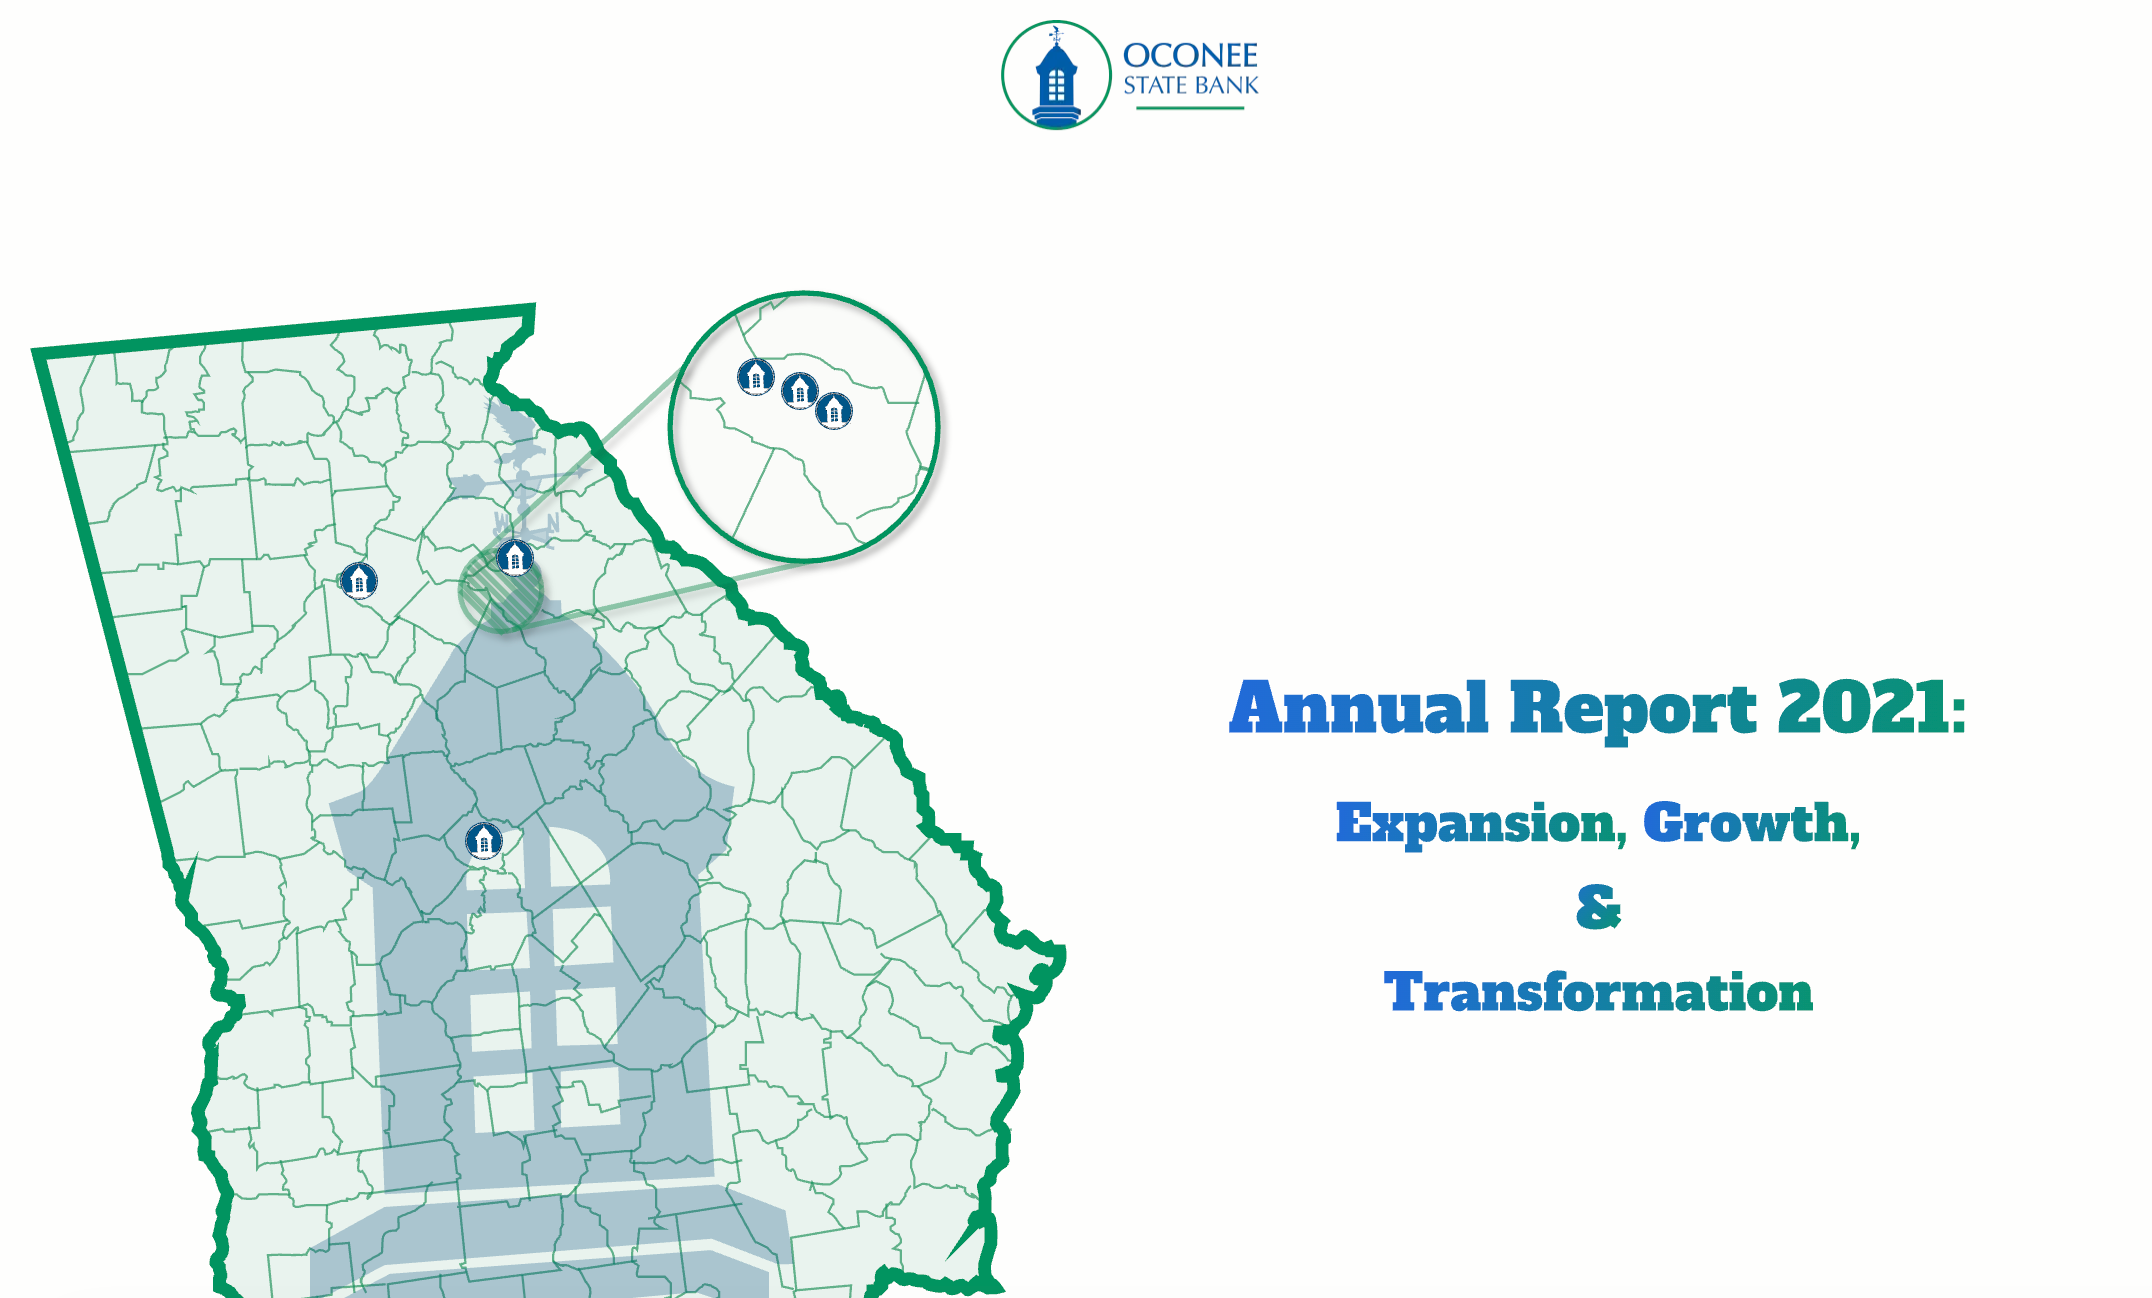
Oconee State Bank’s digital annual report transforms a traditional paper document into a richly interactive web experience. The site presents the bank as a community‑oriented commercial bank headquartered in Georgia and leads with a hero section that includes an animated SVG title and an interactive map with tooltips highlighting the bank’s service areas. Throughout the report, users can read a letter from President Neil Stevens discussing goals such as cultivating a remarkable culture and growing leaders.
The financial highlights section visualises data on net income, book value per share, total assets, loans and deposits between 2017 and 2021 using Chart.js. The accompanying narrative from CFO Jim McLemore explains that 2021 net income increased to $3.0 million and discusses PPP fee income, dividend growth and stock performance. Another section focuses on asset quality, describing how the bank’s loan portfolio composition shifted in 2021, including growth in owner occupied commercial real estate to 38% of the total loan portfolio and noting the impact of SBA PPP loans.
Beyond financials, the report highlights the bank’s vision and mission to be essential to the lives and communities it serves and to create remarkable experiences. The core values are presented through an acronym “SUCCESS,” describing principles like stewardship, unity, collaboration and community. Visitors can also learn about Oconee State Bank’s charitable efforts through The Remarkable Foundation, established in 2020 to support non‑profits in the bank’s communities.
Technical Implementation
- Frontend Framework: Next.js and React with Tailwind CSS for responsive UI
- Animations: Framer Motion and react‑intersection‑observer for scroll‑triggered effects; animated SVG in hero
- Data Visualisation: Chart.js datasets for 2017–2021 metrics (net income, book value per share, total assets, loans, deposits)
- Component Structure: Modular React components per section (corporate profile, president’s letter, financial and asset highlights, boards and teams)
- Interactive Elements: Tooltip‑enabled map highlighting regions (e.g., Gwinnett, Athens, Oconee); cards for investor relations and corporate information
Key Features
- Animated hero with map combining an SVG title and interactive tooltips for service locations
- Financial highlights with interactive charts of five‑year trends and explanatory commentary
- Asset quality analysis covering portfolio composition shifts and small business support
- Narrative content including president’s letter with leadership perspectives and media
- Vision, mission and values presented with branded styling and decorative elements
- Community engagement via The Remarkable Foundation with donation prompts
- Board and team profiles with biographies and leadership grids